
GIS, Maps, Data, and Technology!

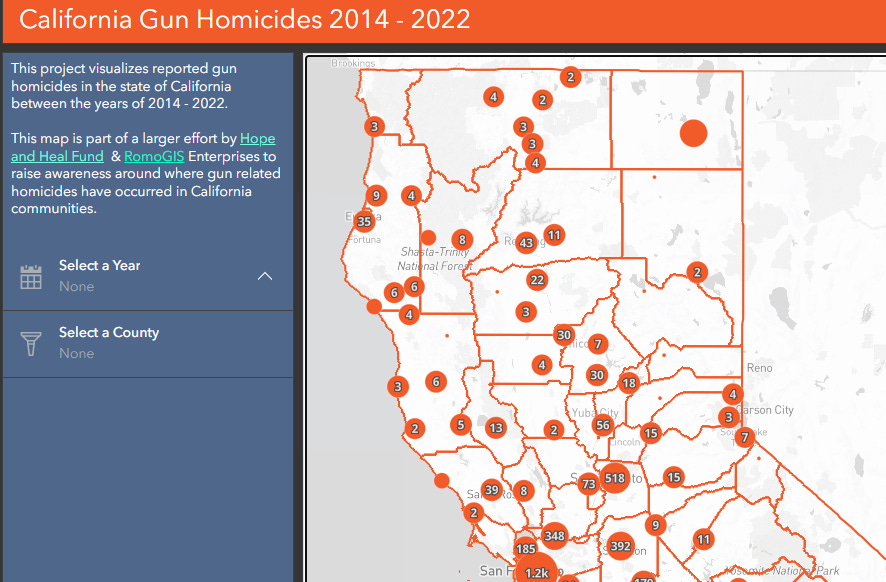
Through a partnership with RomoGIS, a California nonprofit was able to create an interactive map on Esri of homicide data throughout the state. Users can see the data by specific years, counties, or all together. Congrats to everyone involved!
https://hhfund.maps.arcgis.com/apps/dashboards/e3c2aa8feab244de8866ec91cc1aac50
If you’re a GIS technician and would like to partner with NAGV, reach out! We would LOVE to have an interactive GIS map available to the public with additional layers such as school districts, legislative districts, and population. Reach out and let’s get creative!
You can also check out the Nebraska firearm report and let us know your creative ideas on data story telling.
Technologists are likely to have skills that non-profit leaders likely aren’t even aware exist or understand how to utilize. I hope that if you are reading this post, you feel inspired to use your skill set to bring transparency and clarity to the data around gun violence in Nebraska but also wherever you live.